Market Information
|
_______________________________________
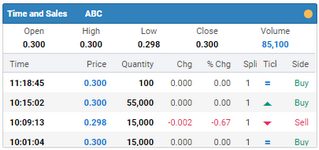
Time & Sales
Use this procedure to view the list of all trades for a specific security with the number of units and the price at which they were executed for a given day. The Change column displays the price change in comparison to previous close and Splits show the number of orders in the trade. The up-tick (Green arrow) indicates that the last trade was at a higher price than the one preceding it. A down-tick (Red arrow) means that the last price was lower than the one preceding it.
PROCEDURE
To view Time and Sales:
1.On the side panel select  . . 2.Navigate to the Time and Sales section.
|
|


